Interpretability is going to be the next big shift in ML
As neural networks (especially Large Language Models) get bigger and start saturating benchmarks like ARC-AGI and MMLU, the vibe shifts from: “Wow — this is impressive! ChatGPT is nearly as clever as me!” to: “Okay… but what is it actually doing?”
We mostly understand how these models run (tokens in → encoding → layers of attention and MLPs → decoding → tokens out). But we still don’t really understand why a particular answer appears, or what internal “strategy” the model is using to get there.
That’s why interpretability research is so interesting right now. Recent work from Anthropic is beginning to observe the internal state of LLMs — from understanding hidden goals in misaligned models, to finding Claude 3.5 Haiku has memorised the addition table for single-digit numbers, to controlling and injecting character traits post-training.
Try at NN Playground
What this is
This post isn’t going to be a transformer architecture explainer — there are far better explanations out there. Instead, I wanted to design a system that forces me to internalise the core concepts by building them into something usable.
The design goal
The initial idea was a visual neural network playground that makes the full lifecycle of training feel tangible.
- Visual: No coding — coloured diagrams, icons, drag-and-drop.
- Accessible: Runs in the browser so anyone can try it without setup.
- Expandable: No hard-coded limits on architectures you can build.
- Observable: Inspect weights/biases at every stage, and do experiments like freezing parameters to see what changes.
Tech stack
I wanted no external dependencies on centralised infrastructure for running the models, so I opted for Next.js + TensorFlow.js . That lets the whole thing run locally: your GPU/CPU does the work, and the playground stays self-contained.
Features
The neural network playground shows the complete flow you might take when building a neural network — from designing the structure, to shaping the dataset, to training and evaluation, to iterating.
From here, the core loop is: build → train → inspect → change one thing → repeat. The entire point is to make the “invisible” parts of learning visible enough that you can form real intuitions.
Build
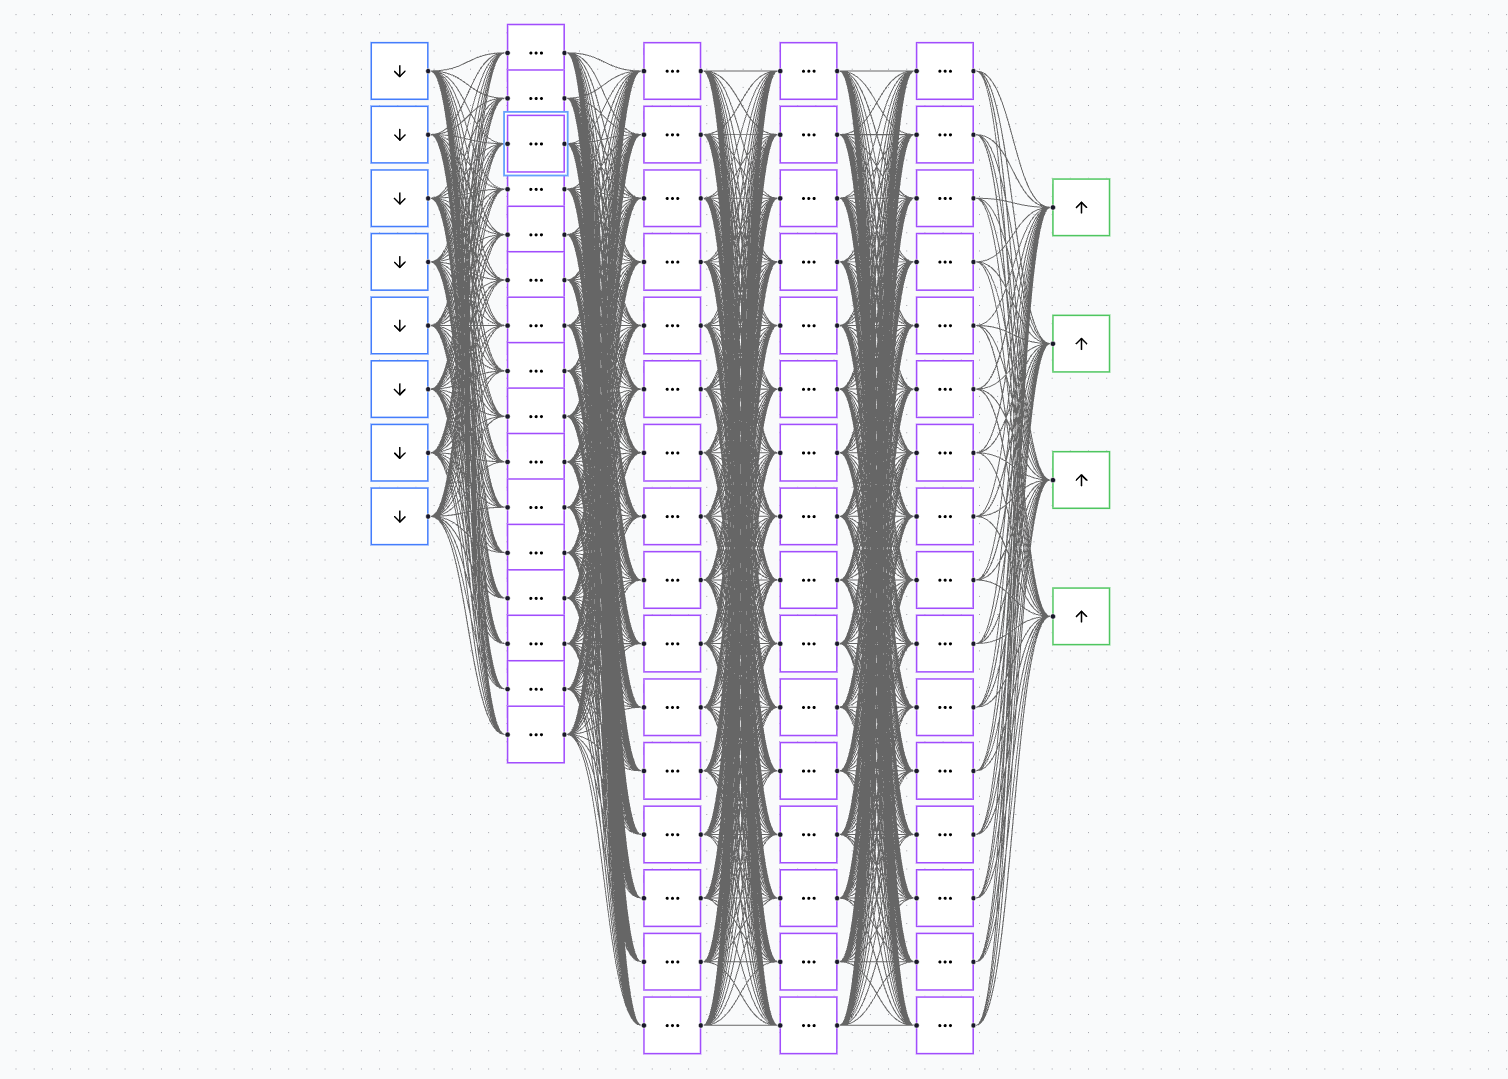
The decision to use an infinite canvas came from one simple constraint: it’s the UI that best matches the four objectives.
It’s visual, because you can see the entire architecture at a glance. It’s accessible, because each colour-coded block represents a different neuron type. It’s expandable, because you can drag, drop, and connect neurons as the network grows. And it’s observable, because every neuron and connection is explicit — nothing is hidden behind code.
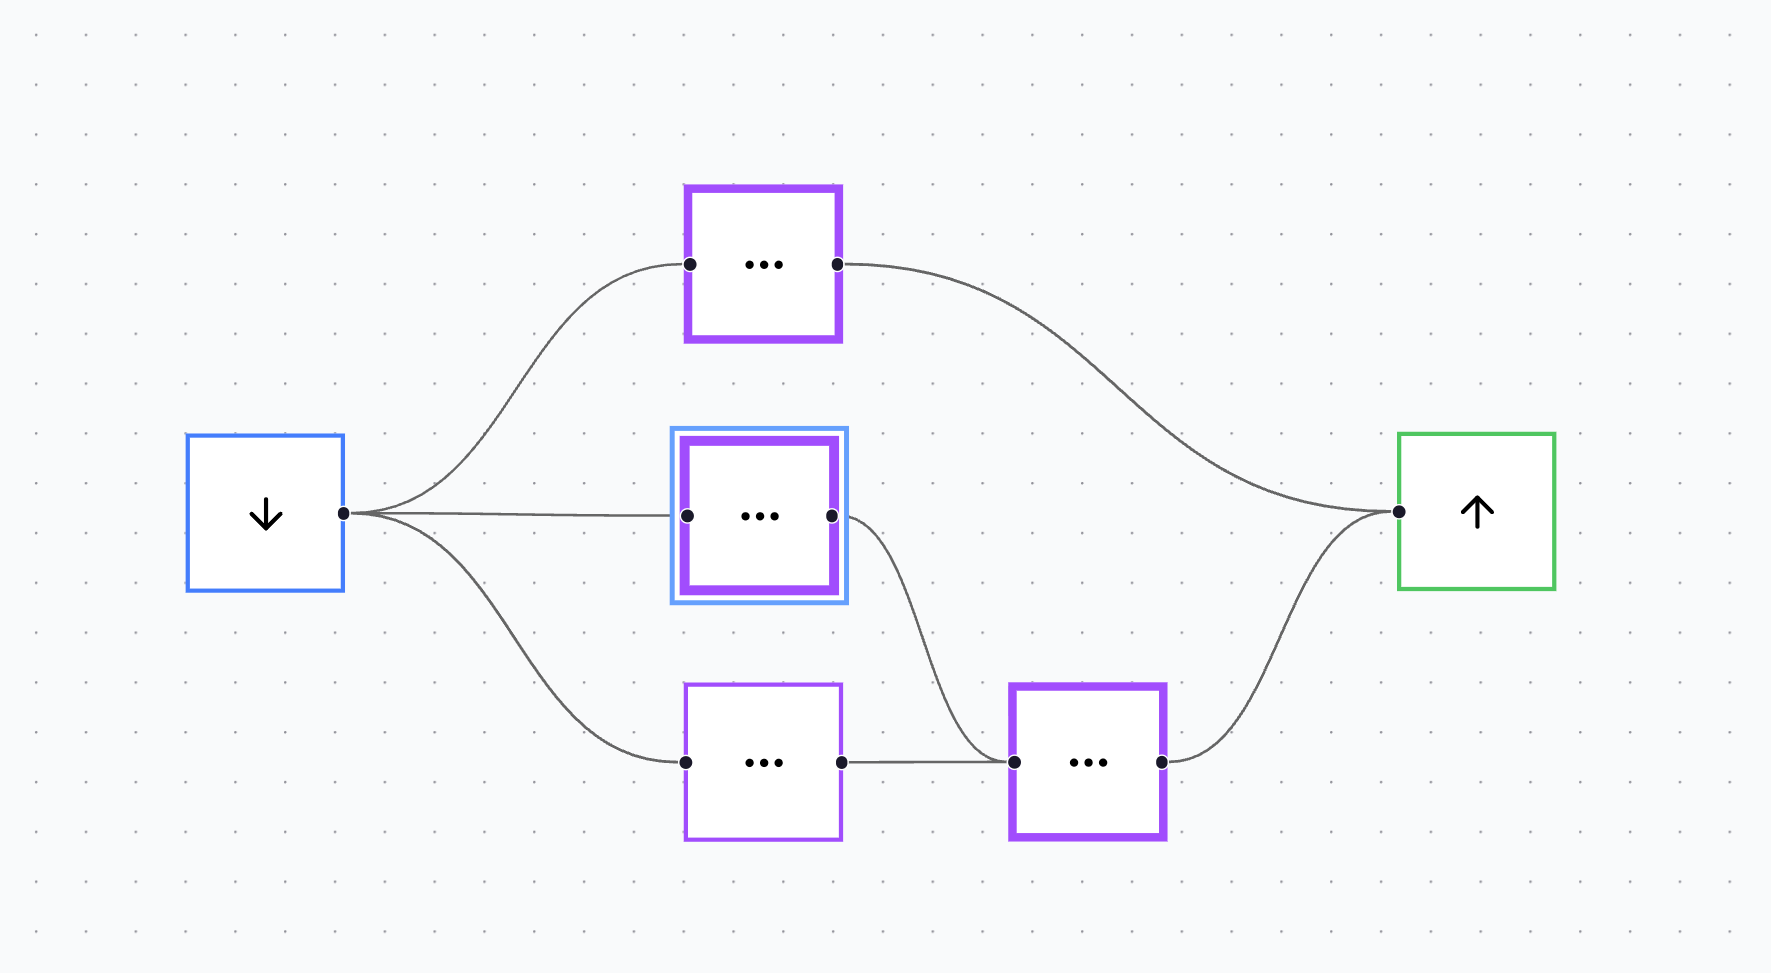
Right now, the playground supports three neuron types for a simple MLP:
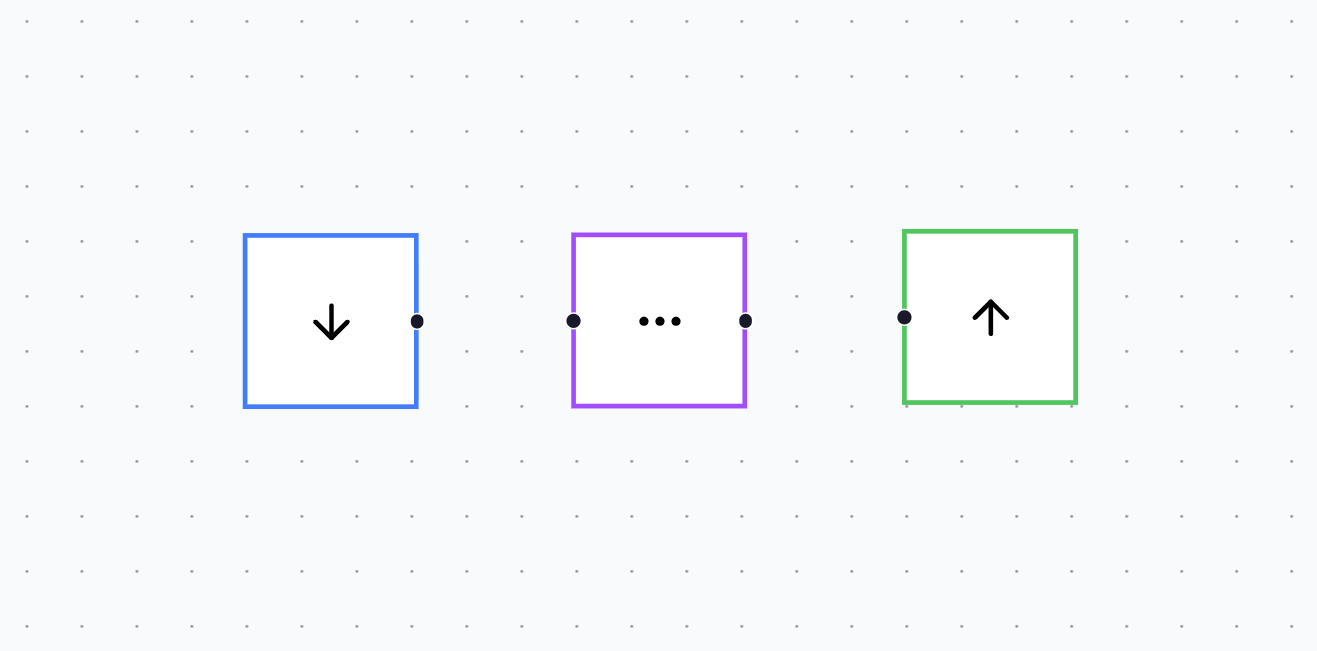
- Input neuron (blue)
- Hidden layer neuron (purple)
- Output neuron (green)
To create a network, you drag neurons onto the canvas, move them into place, and connect them to define the direction of data flow. This design is deliberately tactile: it makes the architecture feel like something you construct, not something you configure.
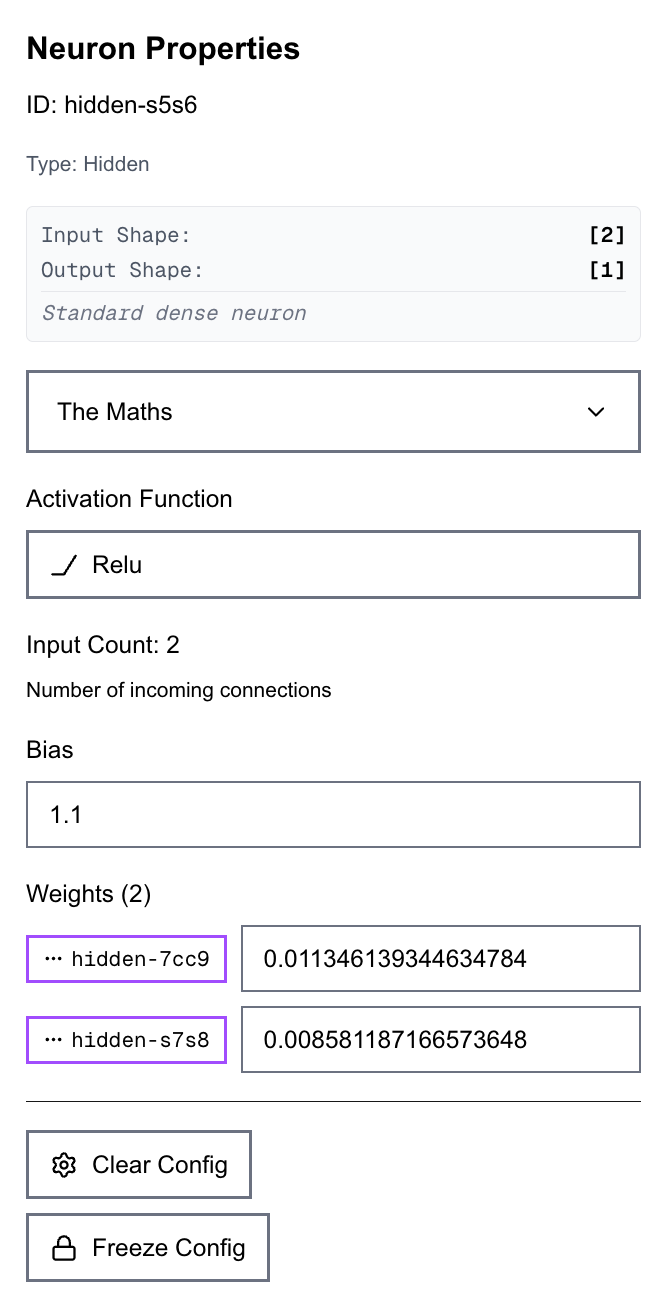
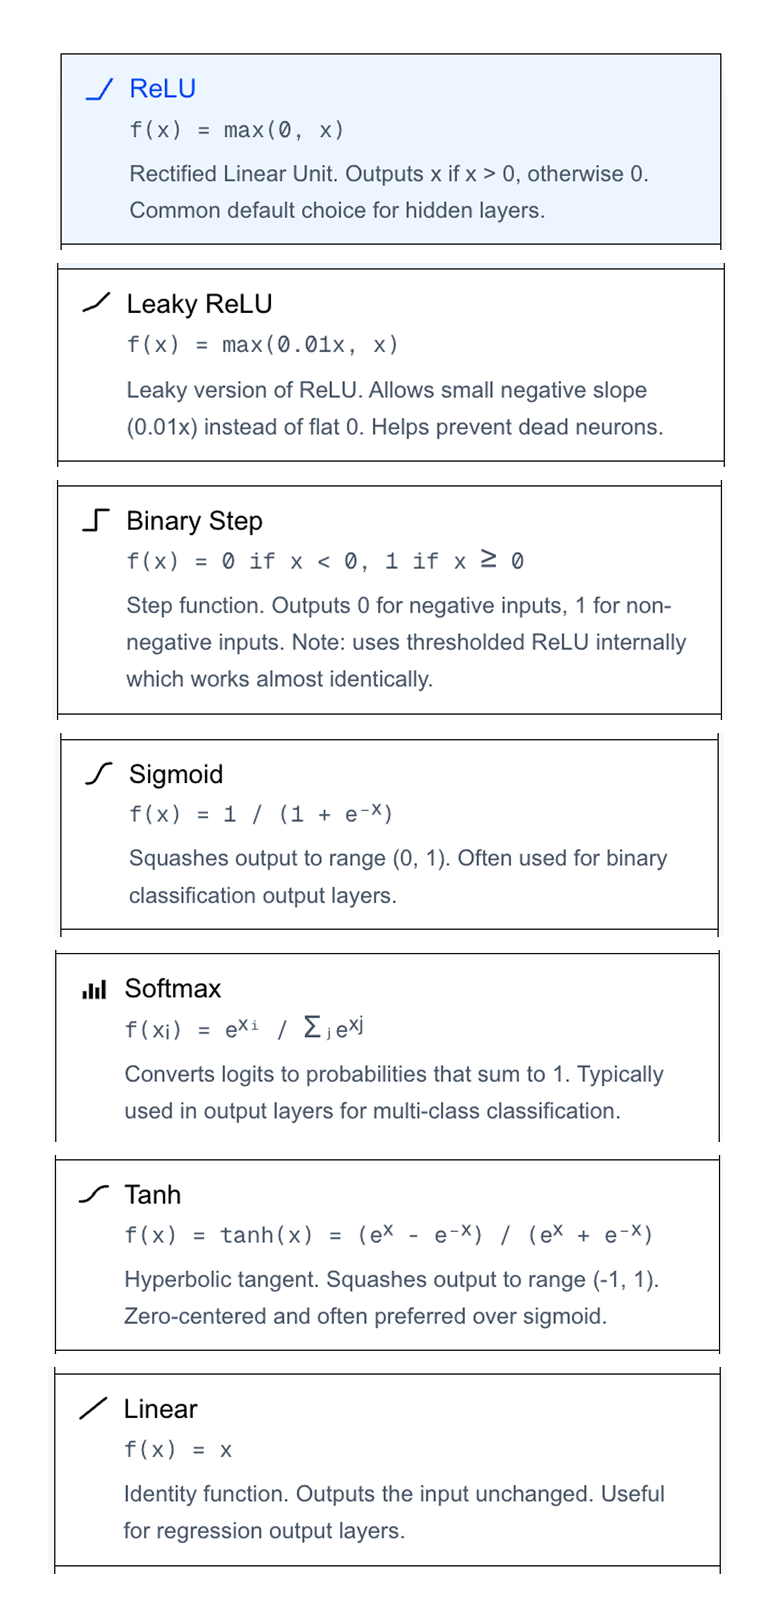
Clicking any neuron opens a properties panel where all information about the neuron is visible. You can set the activation function, inspect input and output shapes, and directly inspect and edit the weights and biases of that neuron.
You can also run more controlled experiments, such as freezing individual weights or biases inside a neuron, and defining sparse connectivity so only specific neurons can influence specific downstream neurons.
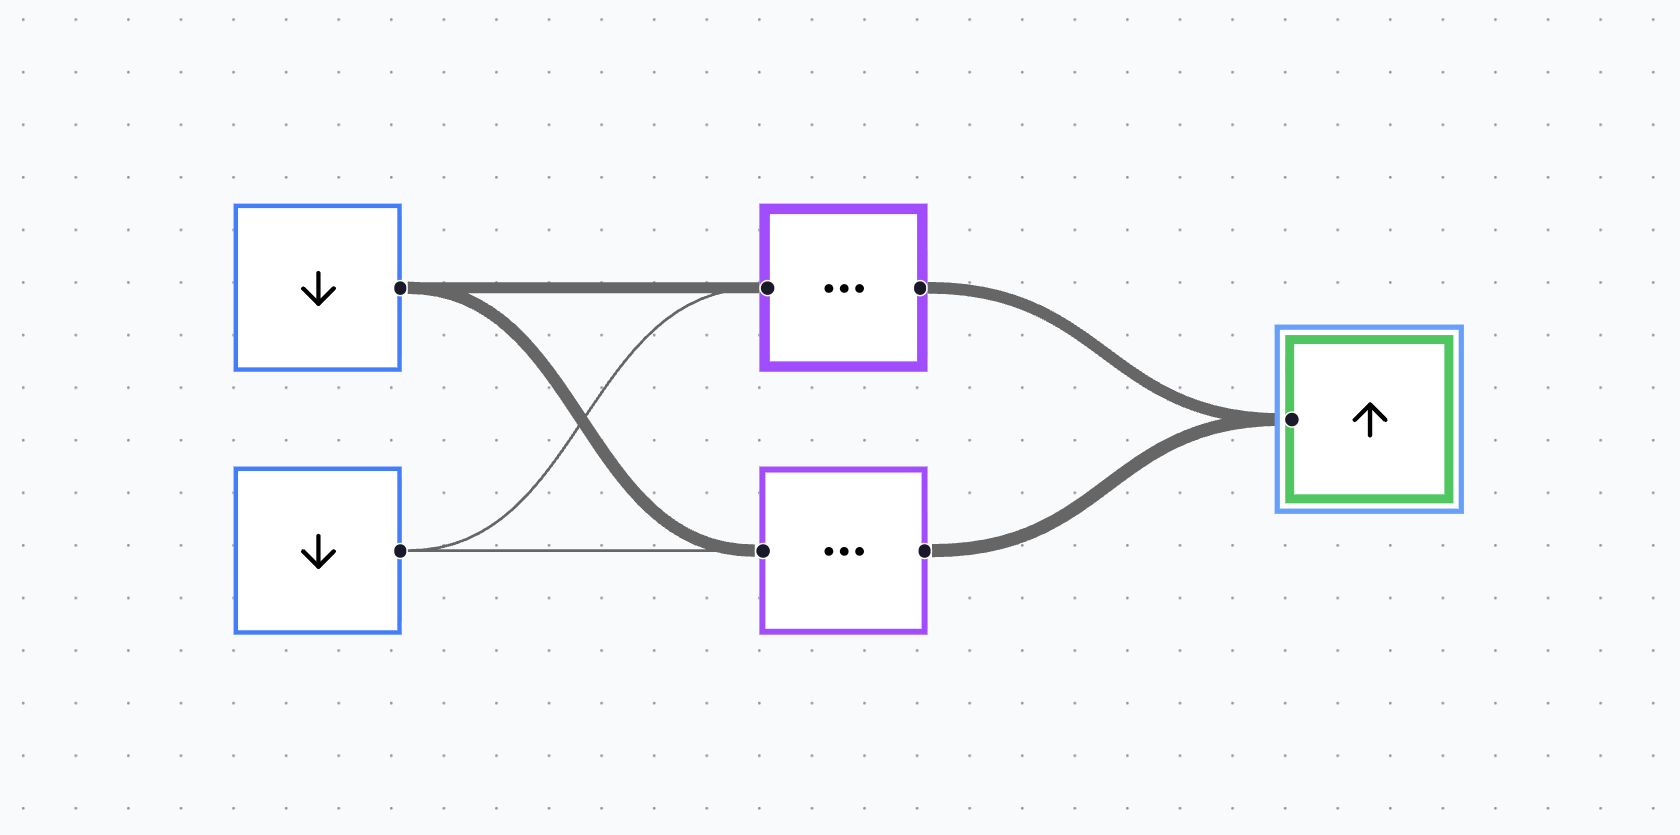
The canvas also adds a second layer of observability after training. Connections can change in thickness proportional to their learned weights, while a neuron’s outline can thicken proportional to its bias. The result is a clean, immediate “shape” of what the model learned, without needing to open a console or read a tensor dump.
Defining the dataset
Arguably, the most important part of designing any ML system is the dataset. Because with garbage data in, you’re going to get garbage predictions out.
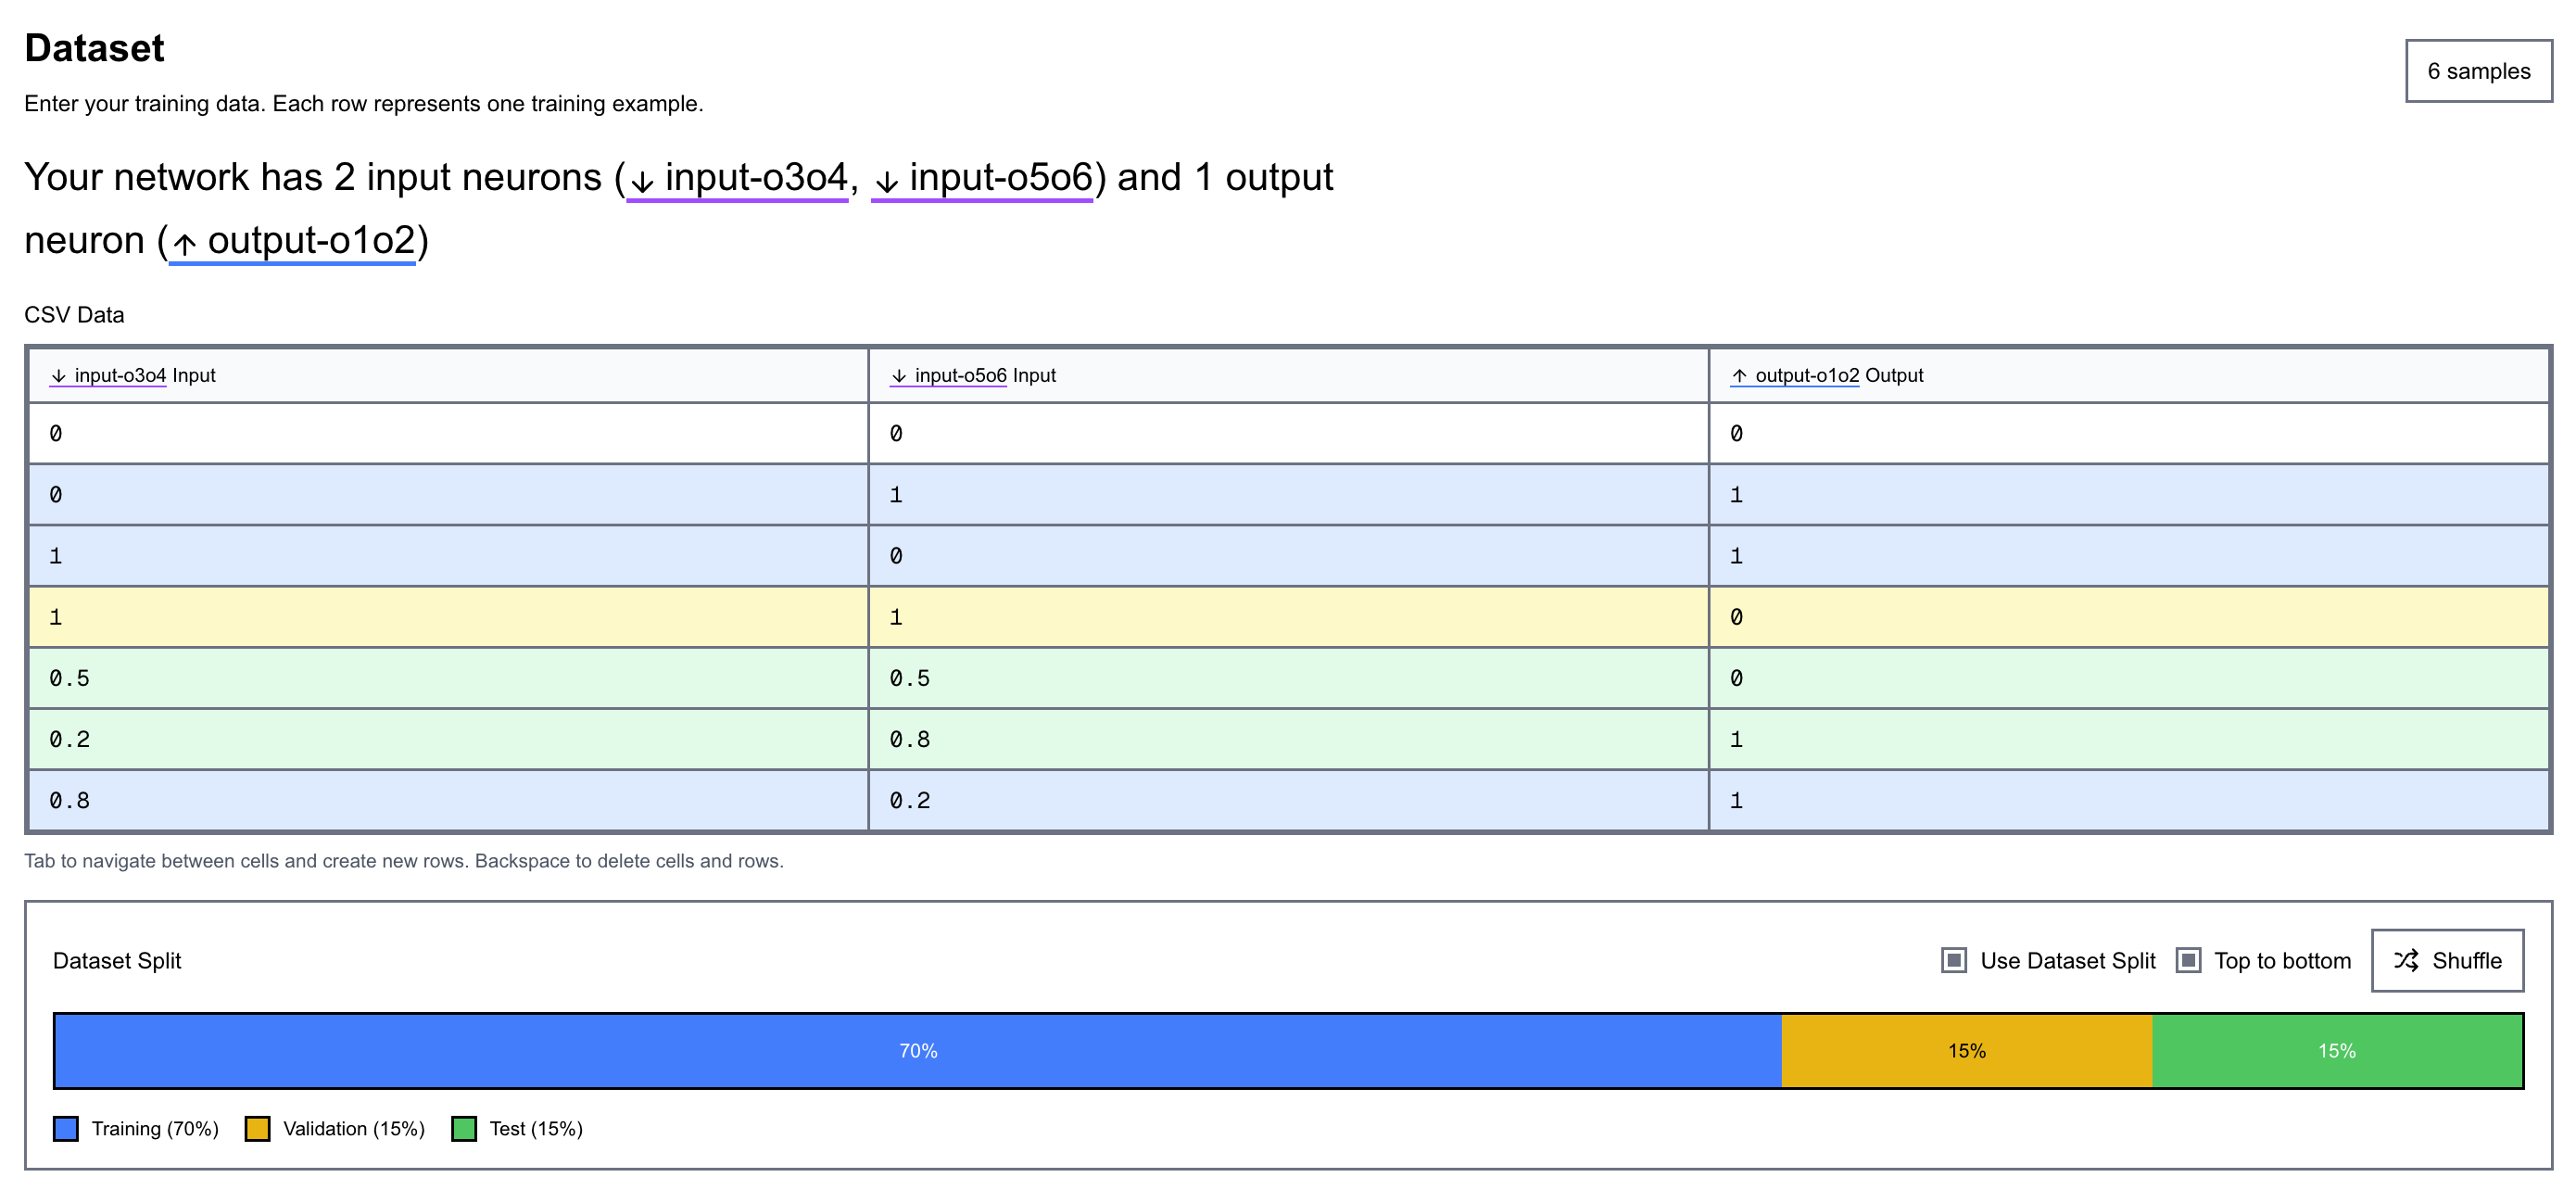
The dataset interface is designed to automatically conform to the network’s input shape, so what you see always matches what the model expects. It’s also built to be easy to read, with the rows and columns colour-coded, and those colours stay consistent across the app (the same blue/purple/green used for neurons and layers). This kind of consistent visual mapping reduces cognitive load, and you start recognising meaning by colour instantly, without having to re-read labels every time.
You can also split the dataset into training, validation, and test sets visually. Splits can be shuffled or kept ordered, which makes it easy to test for distribution issues (or bias) across splits and keeps the whole pipeline observable. It also allows controlled tests to be run to see how the dataset split affects training and network performance.
Training
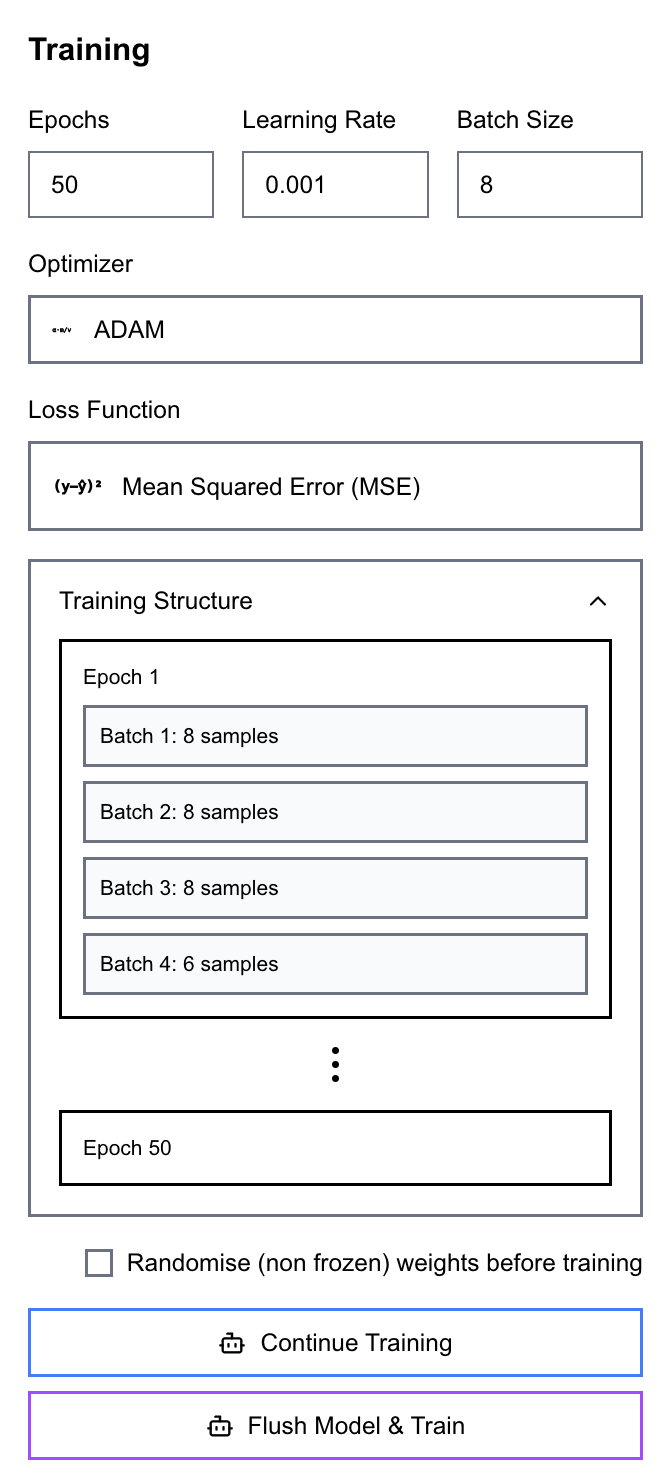
Training is as simple as going to the Train tab and clicking Train. Seriously — it’s that simple.
However, naivety isn’t always bliss. So while the workflow stays simple, it remains powerful. You can still specify epochs, learning rate, batch size, optimiser (via a dropdown: SGD or Adam), and the loss function (MSE, MAE, Binary Crossentropy). You can also visualise the training structure itself by seeing a representation of epochs and the batches inside each epoch.
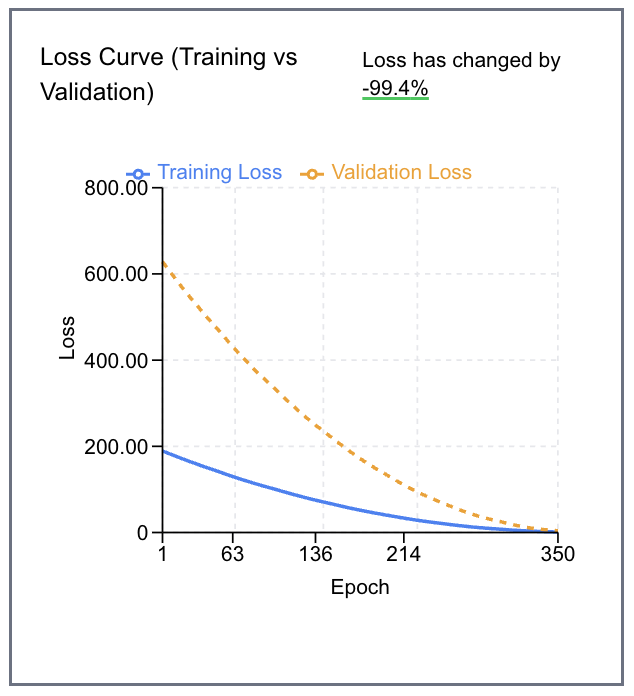
During training, a live plot tracks loss (as defined by your selected function) against epoch count for both the training and validation sets.
All of this runs entirely in the browser using TensorFlow.js — no server-side training infrastructure required.
Inspect, Evaluate and Iterate
Post-training, you can move to the Inference tab to enter values manually and test the network on unseen data — or, if you’ve defined a test set, run an automatic evaluation against it.
Throughout this process, the visuals and numbers update in real time to reflect the current state of the model. Want to change the architecture? Drag in another hidden neuron, reconnect the graph, then train and evaluate again! That tight feedback loop is the point: it encourages quick, hypothesis-driven iteration using intuition and understanding of the full data-flow.
One subtle benefit of keeping everything visible is that you can build intuition for failure modes. For example, when performance is off, you can ask: is the data wrong (is the split bias?), is the model underpowered (or do we have too many layers and parameters?), are we overfitting (is the loss not changing, or fluctuating widely?), or is the loss/optimiser mismatch causing instability?
Final Thoughts
To recap, the objective was to design an intuitive interface for learning and building neural networks that is visual, accessible, expandable, and observable.
While it covers the basics, there’s a lot I want to add next! On the architecture side:
- More neuron types (e.g. recurrent neurons)
- More layer primitives (flatten layers, global pooling)
On the data side:
- Support for multimodal inputs/outputs and richer evaluations. For example, building a dataset, training and observability pipeline to support building a network trained off the MNIST dataset
And training itself shouldn’t stop at supervised learning. A natural extension is to add unsupervised and self-supervised objectives, and eventually agent-style training loops where the model learns via interaction (an action → observation cycle), not just labelled examples.
Try at NN Playground
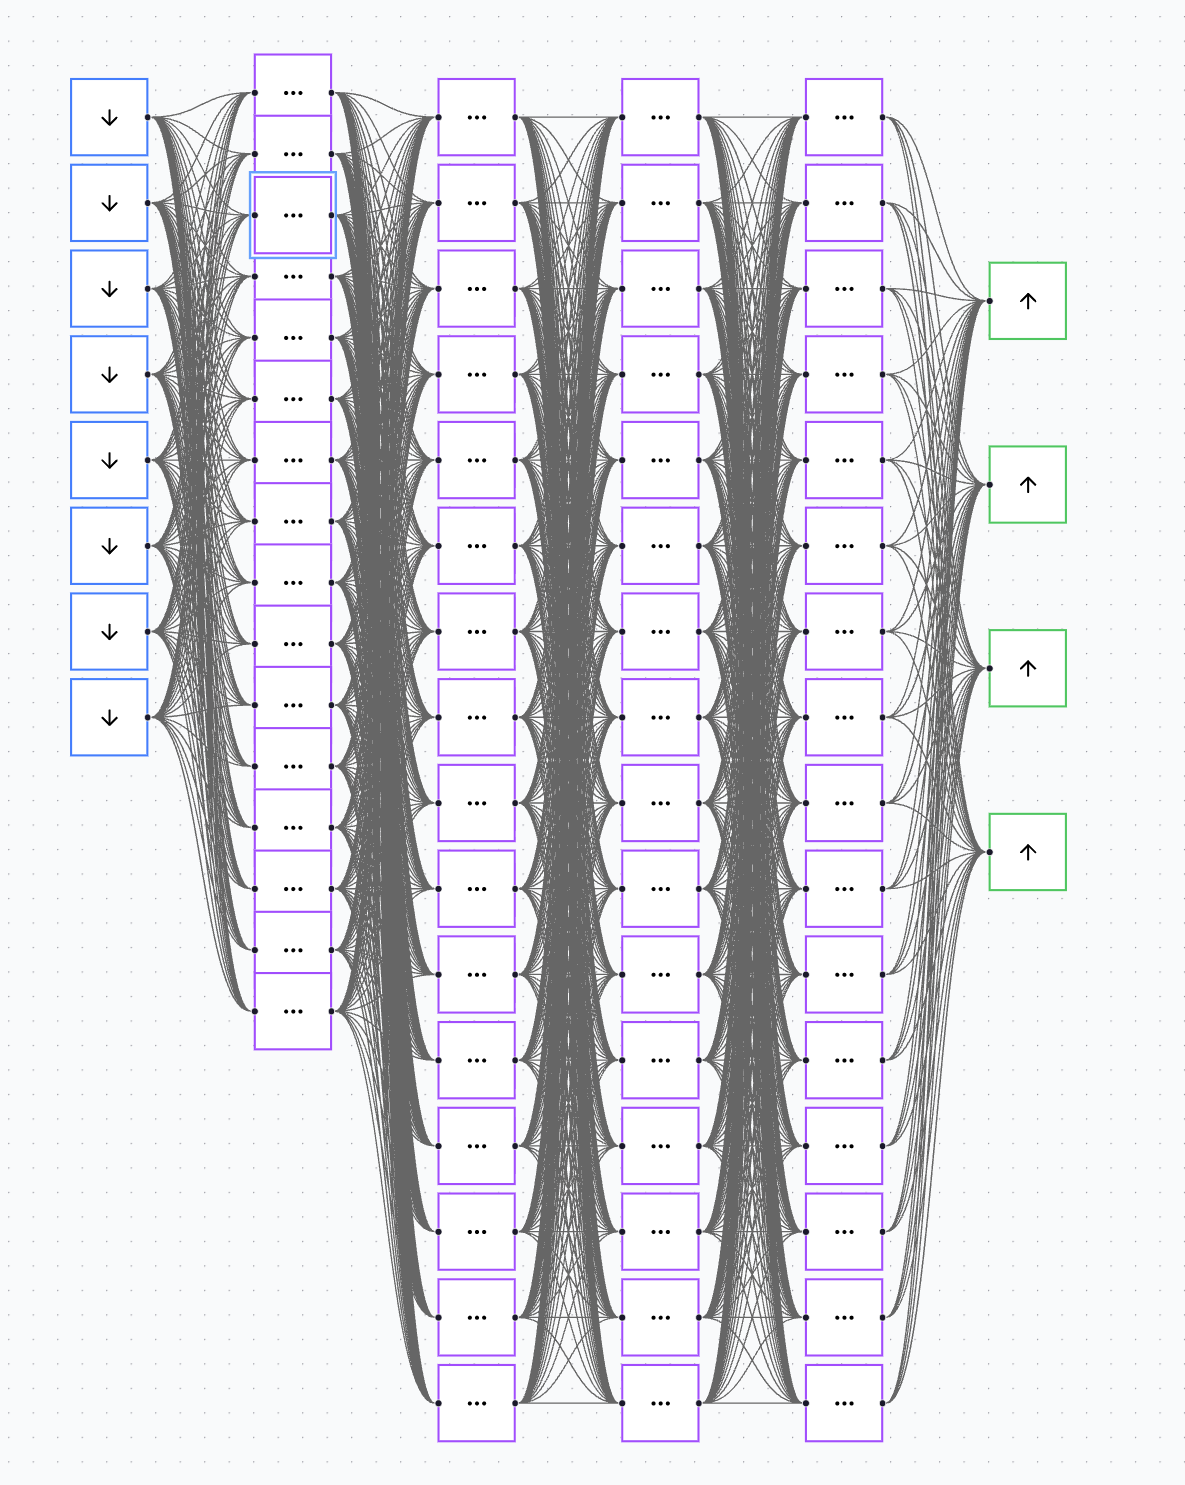
Oh - and it works with larger networks too!